Correlation Of Morphology Characteristics For Varieties At Location Xian
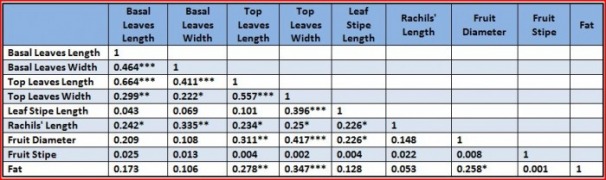
Table 3: When significance level(α) is 0.05,0.01,0.001,degree freedom is 90, the correlation(r) is 0.205, 0.267, 0.338, respectively. The table shows that the correlaiont between leaves is always significant. Rachils' length has significant correlation with both top and basal leaves. Leaf stipe length has significant correlation with top leaves width. However, fruit diameter has significant correlation with top leaves and leaf stipe length. None plant or fruit traits has significant correlation with fruit sitpe. Fat percentage has significant correlaiotn with top leaves and fruit diameter.
Canonical Correlation Analysis Of Varieties In Location Xian
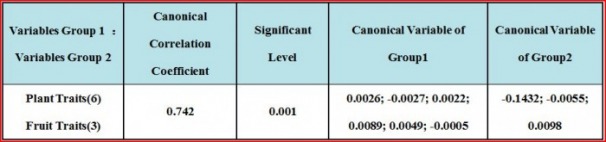
Table 4: The canonical correlation coefficient between plant traits and fruit traits is 0.742, which means the relationship between plant traits and fruit traits is very close. It appears that none of the 6 plant traits takes a main role for the canonical correlation coefficient, and fruit diameter takes a major comparatively role, which means plant traits mainly relates with fruit diameter.
Correlation Of Morphology Characteristics For Varieties At Location Cheng
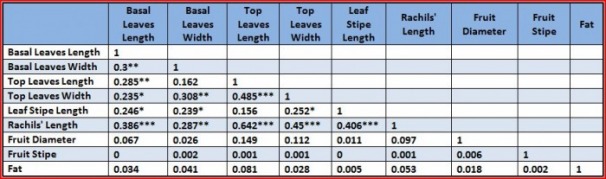
Table 5: The table shows top leaves and basal leaves always have significant correlation. Rachis' lengh has significant correlation with leaves and leaf stipe length. The fruit traits have no significant correlation with all the plant traits.
Canonical Correlation Analysis Of Varieties In Location Cheng
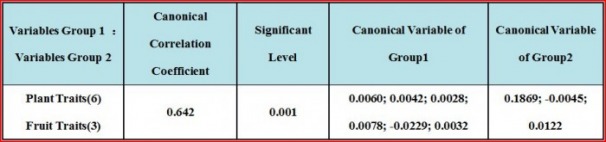
Table 6: The canonical correlation coefficient between plant traits and fruit traits is 0.642, which means the relationship between plant traits and fruit traits is close. It appears that none of the 6 plant traits takes a main role for the canonical correlation coefficient, and fruit diameter takes a major comparatively role, which means plant traits mainly relates with fruit diameter.
By comparison with correlation coefficient of morphology characters for varieties both at location Xian and Cheng, it can be found that the correlations between leaves( all for length and width, basal and top) are both significant. For both locations rachils’ length has significant correlation with leaves and leaf stipe length. In both locations fruit stipe has no significant correlation with plant’s traits. However, only in location Xian, fruit diameter has significant correlation with top leaves and leaf stipe length, and for fat percentage it has significant correlation with top leaves and fruit diameter.
Analysis Of Fat Percentage Of 6 Varieties
From the bar chart comparison of all 6 varieties it can be seen that variety Da and Xiao have higher fat percentage than variety Dou, Sha and Gou, and the difference in higher and lower varieties is not large. To confirm the difference is cause by random chance or by variety difference, ANOVA can be conducted for this analysis.
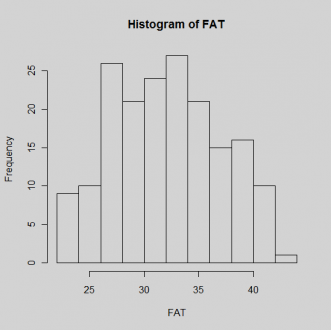
Fig 10: For ANOVA analysis normal distribution of data is assumed. From the histogram of fat percentage it looks like the assumption of normality is violated.
To further check data normality Shapiro test is used by R project, and the p-value is 0.008754, so the data is not normally distributed. Then the data is transformed by logarithm and square root, but neither transformation works. In this case, Kruskal-Wallis test is conducted and the p-value is 2.99e-12,with 5 degree freedom. It means that the population means of 6 varieties are not all equal.
Pair-wise Test
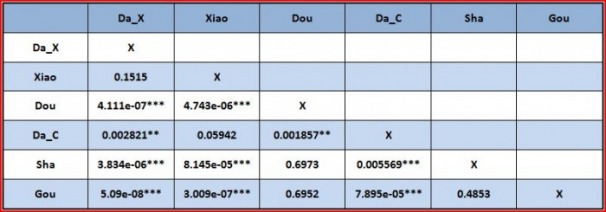
Table 7: From the Pair-wise test it can be known that, variety Da ( in location Xian) and Xiao have no significant difference; variety Xiao and Da ( in location Cheng) have no significant difference; but variety Da ( in location Xian) and Da ( in location Cheng) have significant difference. Variety Dou, Sha and Gou have the same polulation mean.
